Production Observability for $0: How I Monitor My Portfolio with Sentry + Pulsetic

I got my first Sentry weekly report. 23 errors. 1.7k transactions. On a side project. That's what production observability looks like — and it costs $0.
The Email That Made It Real
A few weeks after shipping the monitoring stack, the email landed:
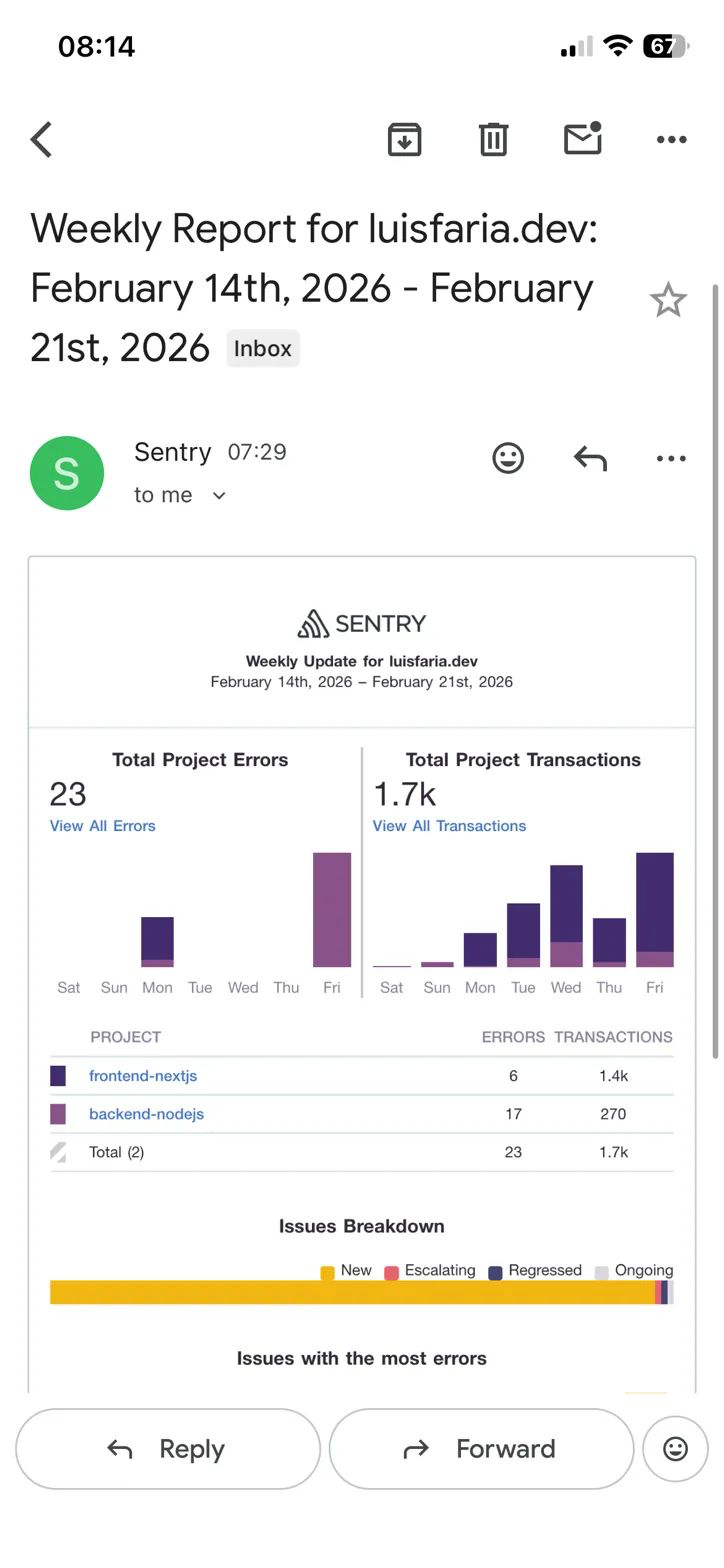
I read it twice. Not because something was on fire — but because this is what production engineers actually see (or should) every Monday morning. Error counts. Transaction volume. Trends. I was flying blind before this. Not anymore.
On this post, I'm sharing details of how I built a 4-layer observability stack on my portfolio (luisfaria.dev) - open source, free tier, real production data.
The Problem: Shipping Blind
My previous dev.to article (From git pull to GitOps) ended with this honest admission in the "Future Roadmap" section:
"Monitoring & Alerting: Sentry for error tracking, uptime monitoring, and resource alerts. Current health checks cover the basics, but production-grade observability is the next evolution."
Once the CI/CD pipeline was working — tests passing, Docker images building, Discord pings on deploy — I had a new problem. I had no idea what was happening after the deploy.
Was the site up? Were there errors? Were users hitting rate limits? Was the server about to OOM?
I didn't know. So I fixed it.
The Architecture: 4 Layers
┌─────────────────────────────────┐
                │   External Uptime Monitor       │
                │   (Pulsetic)                    │
                │   Pings /health/ready every 60s │
                └────────────┬────────────────────┘
                             │ HTTPS
                ┌────────────▼────────────────────┐
                │   Nginx (reverse proxy)         │
                │   Port 80/443                   │
                └────────────┬────────────────────┘
                             │
          ┌──────────────────┼──────────────────┐
          │                  │                  │
┌─────────▼───────┐  ┌──────▼──────────┐  ┌─────▼───────┐
│  Frontend       │  │  Backend API    │  │  MongoDB    │
│  (Next.js)      │  │  (Express)      │  │  + Redis    │
│  @sentry/nextjs │  │  @sentry/node   │  │             │
└────────┬────────┘  └──────┬──────────┘  └─────────────┘
         │                   │
         └─────────┬─────────┘
                   │
          ┌────────▼────────┐
          │   Sentry.io     │
          │   Error Tracking│
          └─────────────────┘

┌─────────────────────────────────┐
│  Cron (every 5 min)             │
│  monitor-resources.sh           │
│  CPU / Memory / Disk / Docker   │
│  → Discord Webhook              │
│  (deduplicated, 30-min cooldown)│
└─────────────────────────────────┘
Each layer covers a different failure mode:
| Layer | What it catches | Latency |
|---|---|---|
| Health endpoints | Is the process running? DB/Redis connected? | Instant |
| Sentry | Code errors, crashes, slow transactions | < 1 min |
| Pulsetic | External view — is the site reachable? | < 2 min |
| Cron script | CPU/Mem/Disk/Docker going wrong | < 5 min |
Layer 1: Tiered Health Endpoints
Before wiring up external monitors, I needed something for them to ping. I built three tiers — each with a different audience and a different level of detail.
// backend/src/routes/health.ts

// Liveness probe — "is the process running?"
// Always 200. Load balancers use this.
router.get('/health', (_req, res) => {
  res.status(200).json({ status: 'ok' });
});

// Readiness probe — "can it serve traffic?"
// 200 when healthy, 503 when degraded.
// Pulsetic targets this endpoint.
router.get('/health/ready', async (_req, res) => {
  const { healthy, checks } = await runChecks();

  // Strip latencies — no sensitive details for public consumers
  const coarseChecks: Record<string, { status: string }> = {};
  for (const [key, val] of Object.entries(checks)) {
    coarseChecks[key] = { status: val.status };
  }

  res.status(healthy ? 200 : 503).json({
    status: healthy ? 'ok' : 'degraded',
    timestamp: new Date().toISOString(),
    checks: coarseChecks,
  });
});

// Internal diagnostics — full checks + system info
// IP-whitelisted: loopback, Docker bridge, 10.x private networks only.
// CI pipeline uses this from inside the Docker network.
router.get('/health/details', async (req, res) => {
  if (!isTrusted(req)) {
    res.status(403).json({ error: 'Forbidden' });
    return;
  }

  const { healthy, checks } = await runChecks();
  const system = getSystemInfo();

  res.status(healthy ? 200 : 503).json({
    status: healthy ? 'ok' : 'degraded',
    timestamp: new Date().toISOString(),
    checks,   // includes latencies
    system,   // includes memoryUsage, loadAvg, cpus, uptime, nodeVersion
  });
});
The IP guard for /health/details is worth calling out:
const TRUSTED_EXACT = new Set(['127.0.0.1', '::1', '::ffff:127.0.0.1']);
const TRUSTED_PREFIXES = [
  '10.',
  ...Array.from({ length: 16 }, (_, i) => `172.${16 + i}.`),
  // Docker bridge ranges: 172.17.x through 172.31.x
];

function isTrusted(req: Request): boolean {
  const ip = req.ip || req.socket?.remoteAddress || '';
  if (TRUSTED_EXACT.has(ip)) return true;
  return TRUSTED_PREFIXES.some((prefix) => ip.startsWith(prefix));
}
Calling it from the public internet returns 403 Forbidden. From inside Docker (CI pipeline) it returns the full diagnostics JSON.
Layer 2: Sentry — Error Tracking for Both Services
The Backend Setup (@sentry/node)
The critical thing: Sentry must be the very first import in backend/src/index.ts. Before Express, before Apollo, before anything.
// backend/src/instrument.ts
import * as Sentry from '@sentry/node';
import type { EventHint } from '@sentry/node';
import { GraphQLError } from 'graphql';

const AUTH_CODES = new Set(['UNAUTHENTICATED', 'FORBIDDEN', 'BAD_USER_INPUT']);

if (process.env.SENTRY_DSN) {
  Sentry.init({
    dsn: process.env.SENTRY_DSN,
    environment: process.env.NODE_ENV,
    tracesSampleRate: process.env.NODE_ENV === 'production' ? 0.2 : 1.0,

    beforeSend(event, hint: EventHint) {
      // Skip HTTP 401/403 — auth flow, not bugs
      const statusCode = event.contexts?.response?.status_code;
      if (statusCode === 401 || statusCode === 403) return null;

      // Skip GraphQL auth/validation errors
      const original = hint.originalException;
      if (original instanceof GraphQLError) {
        const code = original.extensions?.code;
        if (typeof code === 'string' && AUTH_CODES.has(code)) return null;
      }

      return event;
    },

    initialScope: { tags: { service: 'portfolio-api' } },
  });
}
The beforeSend filter is important. Without it, every unauthenticated API request fires a Sentry event. That's noise, not signal — so I filter out UNAUTHENTICATED, FORBIDDEN, BAD_USER_INPUT, and HTTP 401/403.
For GraphQL specifically, I added an Apollo plugin that captures non-auth errors:
// In Apollo Server setup (backend/src/index.ts)
plugins: [
  {
    async requestDidStart() {
      return {
        async didEncounterErrors({ errors }) {
          for (const err of errors) {
            const code = err.extensions?.code as string | undefined;
            if (!AUTH_CODES.has(code ?? '')) {
              Sentry.captureException(err);
            }
          }
        },
      };
    },
  },
],
The Frontend Gotcha: instrumentation.ts
This is the part that trips up almost everyone on Next.js 13+. It gave me more work than expected. You can install @sentry/nextjs, add sentry.client.config.ts, wrap your config with withSentryConfig() - and still get zero frontend errors in Sentry.
The missing piece: frontend/src/instrumentation.ts.
// frontend/src/instrumentation.ts
export async function register() {
  if (process.env.NEXT_RUNTIME === 'nodejs') {
    await import('../sentry.server.config');
  }

  if (process.env.NEXT_RUNTIME === 'edge') {
    await import('../sentry.edge.config');
  }
}
This file is Next.js's official hook for initializing server-side code. Without it, Sentry's server/edge SDK never initializes, so SSR errors and API route errors silently vanish.
You need three Sentry config files at the frontend root:
frontend/
├── sentry.client.config.ts  ← browser-side errors + session replay
├── sentry.server.config.ts  ← SSR error capture
├── sentry.edge.config.ts    ← middleware error capture
└── src/
    └── instrumentation.ts   ← THE HOOK THAT WIRES IT ALL TOGETHER
And next.config.ts needs to be wrapped:
// frontend/next.config.ts
import { withSentryConfig } from '@sentry/nextjs';
export default withSentryConfig(nextConfig, sentryWebpackPluginOptions);
I also added src/app/global-error.tsx to catch React rendering errors. Otherwise component-level crashes disappear without a trace.
Layer 3: Pulsetic — External Uptime Monitoring
Sentry tells you about code errors. Pulsetic tells you if the whole site is unreachable. These are different problems.
Setup is 5 minutes:
- Create a free account at pulsetic.com
- Add monitor:
https://luisfaria.dev/health/ready - Check interval: 60 seconds, regions: Sydney + US East
- Confirmation period: 2 checks (avoids false positives during rolling deploys)
- Alert channel: Discord webhook
The key insight: configure Pulsetic to alert on 503, not just timeouts. When MongoDB goes down, /health/ready returns 503 degraded — not a network failure, but definitely something I want to know about.
Requiring 2 consecutive failures prevents alert spam during a normal deploy. Containers restart, health checks briefly fail - that's expected. Two consecutive failures means something is actually broken.
Layer 4: Cron Resource Monitor
Sentry and Pulsetic cover errors and availability. But what about the server silently running out of disk space? Or memory creeping up after a week of traffic? Those kill a VPS quietly - no crash, no error, just degradation.
I wrote a bash script that runs every 5 minutes:
# server/monitor-resources.sh (simplified)
# Thresholds: 85% for CPU, Mem, Disk
# Alerts: Discord webhook
# Dedup: 30-minute cooldown per alert type

DISCORD_WEBHOOK_URL="${DISCORD_WEBHOOK_URL}"
THRESHOLD=85
STATE_DIR="/var/lib/monitor"

check_memory() {
  local used_pct
  used_pct=$(free | awk '/^Mem:/ {printf "%.0f", $3/$2*100}')
  if [ "$used_pct" -gt "$THRESHOLD" ]; then
    send_alert_if_not_deduped "memory" "Memory at ${used_pct}%"
  fi
}

check_docker() {
  # Alert if any expected container is not running
  for container in frontend_webapp backend_api nginx_gateway mongodb_db redis_cache; do
    if ! docker ps --format '{{.Names}}' | grep -q "^${container}$"; then
      send_alert_if_not_deduped "docker_${container}" "Container ${container} is down"
    fi
  done
}
The deduplication is the part I'm most proud of. Without it, a memory spike at 86% would fire an alert every 5 minutes until someone fixed it. With it, the first alert fires and then nothing for 30 minutes. The disk doesn't lie, but it doesn't need to shout either.
Security model — because this runs with Docker socket access:
| Concern | Solution |
|---|---|
| Runs as | Dedicated monitor system user (no login shell) |
| Docker access | monitor added to docker group (read-only monitoring) |
| Webhook secret | /etc/monitor/monitor.env (chmod 600, owned by monitor) |
| Logs | Logrotate: daily rotation, 7-day retention |
# Setup (on the server)
useradd --system --no-create-home --shell /usr/sbin/nologin monitor
usermod -aG docker monitor

# Cron entry
*/5 * * * * monitor /opt/monitor/monitor-resources.sh >> /var/log/monitor-resources.log 2>&1
Real Data: First Sentry Weekly Report
After running this for one week, the Sentry weekly email arrived:
| Service | Errors | Transactions |
|---|---|---|
| Frontend (Next.js) | 6 | 1,451 |
| Backend (Node.js) | 17 | 270 |
| Total | 23 | 1,721 |
The 17 backend errors were mostly from testing the error-capture flow (I fired test exceptions during setup). The 6 frontend errors included a couple of ResizeObserver events that I subsequently filtered out.
Most importantly: I could see which GraphQL resolvers were slow, which routes had errors, and exactly what the call stack looked like for each failure. Stack traces with source maps. Breadcrumbs showing what the user did before the crash. Session replay for frontend errors (1% of sessions, 100% of errored ones).
What I Learned: SRE Concepts Applied
| Concept | Implementation |
|---|---|
| Liveness probe | GET /health — always 200, load balancers use this |
| Readiness probe | GET /health/ready — 200 or 503, Pulsetic targets this |
| Internal diagnostics | GET /health/details — IP-whitelisted, CI pipeline uses this |
| Error budget | Sentry free: 5K errors/month — if you hit this, something is very wrong |
| Incident detection | Pulsetic catches outages in < 2 min |
| Alert fatigue | 30-min dedup prevents Discord spam |
| Least privilege | Monitor script runs as monitor user, not root |
| Secret management | Webhook URL in restricted /etc/monitor/monitor.env (chmod 600) |
| Graceful degradation | 503 with "degraded" when a dependency is down, not a hard crash |
| Observability pillars | Logs (Winston) + Metrics (health/cron) + Traces (Sentry) |
The Alert Flow
Error in code    → Sentry (instant)         → Sentry dashboard + email
Site goes down   → Pulsetic (< 2 min)       → Discord + email
CPU/Mem/Disk     → Cron script (every 5m)   → Discord (deduplicated)
Deploy fails     → GitHub Actions (instant)  → Discord (existing pipeline)
Container crash  → Cron script (every 5m)   → Discord (deduplicated)
Key Takeaways
1. The instrumentation.ts File Is Not Optional
For Next.js 13+ (/src directory structure), frontend/src/instrumentation.ts is the initialization hook that wires Sentry into SSR and edge runtimes. Skip it and you get zero server-side error data.
2. Filter Before You Drown in Auth Noise
Without beforeSend, every 401/403 becomes a Sentry event. On an app with auth, that's most of your error budget. Filter UNAUTHENTICATED, FORBIDDEN, BAD_USER_INPUT at the source.
3. 503 Is Not "Down" — Design for Degradation
Health checks that return 503 on dependency failures give uptime monitors something actionable. A binary "up/down" monitor misses the nuance of "site works but database is slow."
4. Alert Deduplication Is Not Optional
A 30-minute cooldown on resource alerts prevents alert fatigue. If your phone buzzes every 5 minutes for the same disk usage spike, you'll start ignoring it — which defeats the point.
5. Real Data Changes How You Think
Before the weekly report, I thought about errors abstractly. After seeing "23 errors, 1.7k transactions," the numbers have names, stack traces, and user actions attached. That's the difference between guessing and knowing.
Tech Stack
| Layer | Technology | Cost |
|---|---|---|
| Error tracking | Sentry (free tier: 5K errors/mo) | $0 |
| Uptime monitoring | Pulsetic (free tier: 10 monitors) | $0 |
| Resource alerts | Bash + cron + Discord webhook | $0 |
| Health endpoints | Express routes (already deployed) | $0 |
| Frontend | Next.js + @sentry/nextjs | $0 |
| Backend | Node.js + @sentry/node | $0 |
Try It Yourself
The full implementation is open source:
| Resource | Link |
|---|---|
| Live Site | luisfaria.dev |
| Open Source Repo | https://github.com/lfariabr/luisfaria.dev |
| Health Routes | backend/src/routes/health.ts |
| Backend Sentry | backend/src/instrument.ts |
| Frontend Sentry | frontend/src/instrumentation.ts |
| Cron Script | server/monitor-resources.sh |
| Epic Tracker | Issue #115 — Observability |
Let's Connect
If you're building observability on a budget, working with Next.js + Node.js in production, or navigating Sentry's Next.js integration (that instrumentation.ts gotcha gets everyone), I'd love to trade notes:
- LinkedIn: linkedin.com/in/lfariabr
- GitHub: github.com/lfariabr
- Portfolio: luisfaria.dev
Built with too many Discord pings and one very satisfying weekly Sentry email by Luis Faria
Whether it's concrete or code, structure is everything.